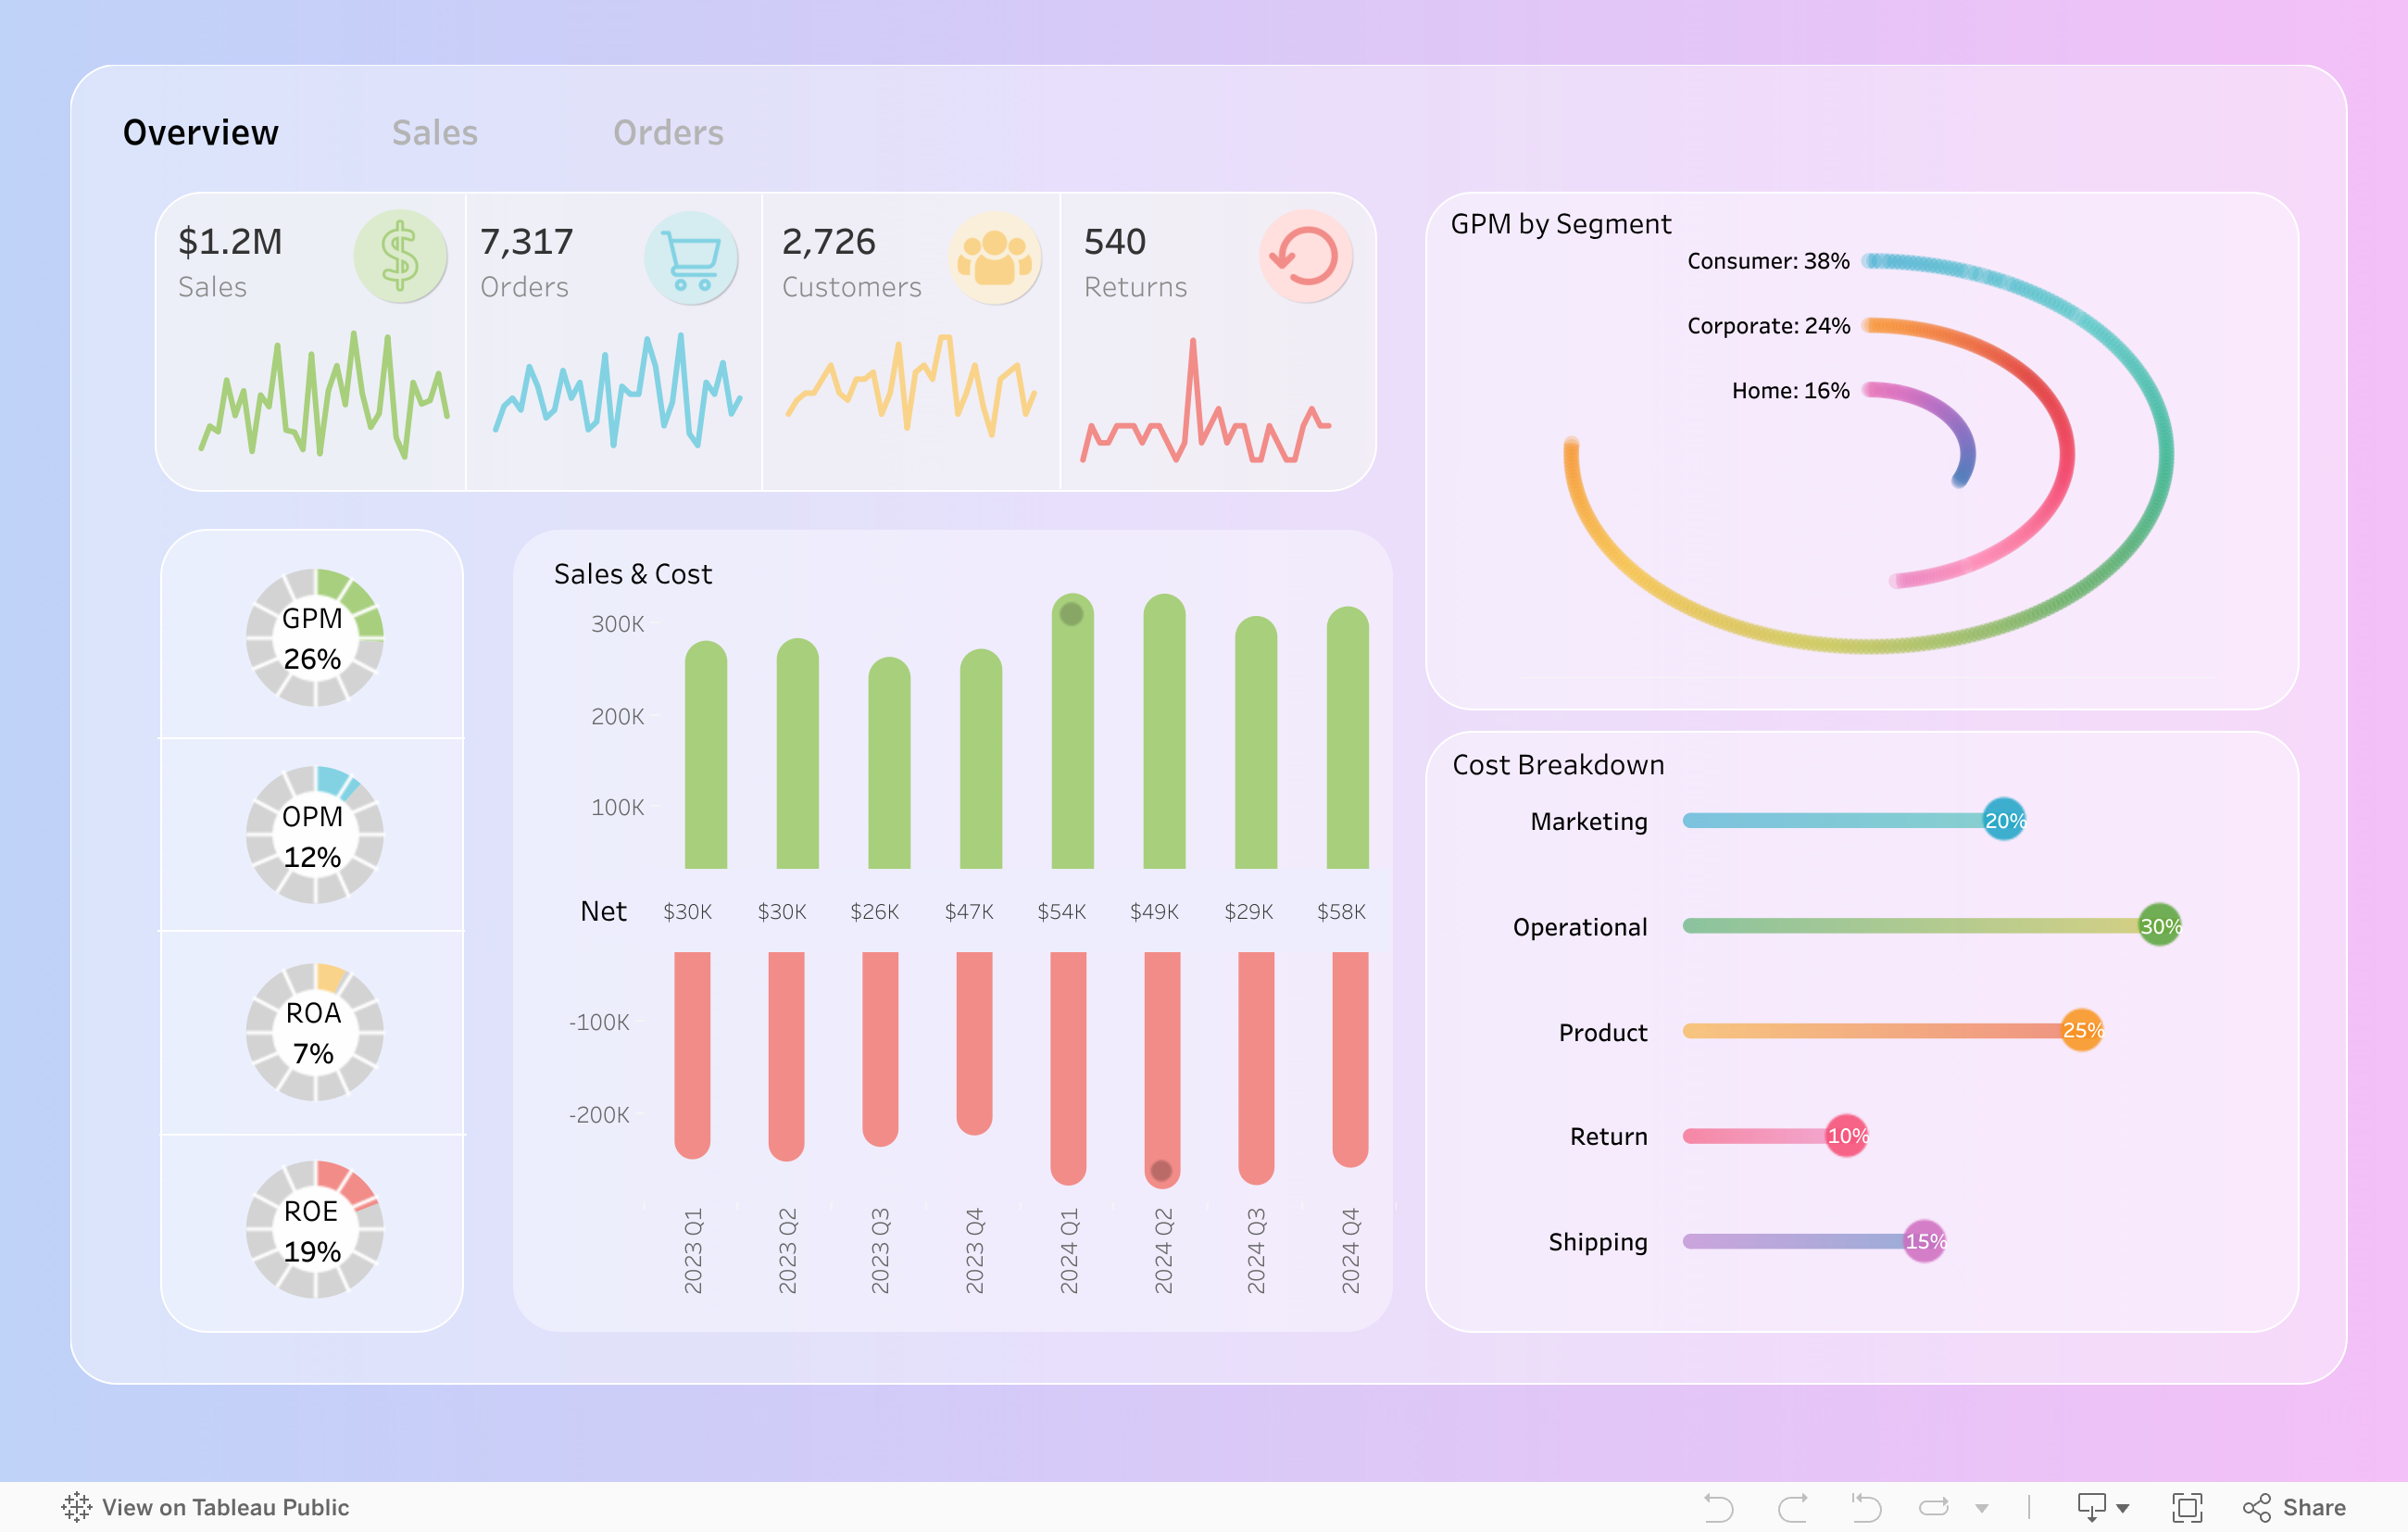
Retail Dashboard
This dashboard represents sales and orders from an imaginary store. Starting with the executive overview page, followed by sales details, and then order details.
Sankey
This Sankey diagram represents revenue and traffic from various sources to a category. These are useful for mapping user journeys and to determine where to spend your advertising dollars.

Superstore Dashboard
This dashboard uses the Superstore dataset. It has interactive tabs at the top to view the data by segment.
